Stoxxtip.com
Stoxxtip.com delivers easy-to-use guidance in global stock selection
for investors who wish to generate above-average returns on their portfolio.
Videos
Most traders are just a few trading secrets away from achieving total consistency, but these secrets can be the difference between success and failure in the markets. Years ago a Floor Trader was taught these very same trading elements that have enabled him to sustain his trading for the past 4 decades.
Technicals
Nestle (NESN) a quality undervalued Swiss stock
written on July 01, 2026
The current price of Nestle is CHF 82.88 and above its 40 week moving average of 78.73. After almost a year of consolidation, this stock, which pays a reliable 3.73% dividend, is poised to move higher.
Research
Could A 'Transaction Tax' Be A Good Thing?
by Lance Roberts

Summary
Over the years, I've heard from several clients who have had trouble disciplining themselves from trading too frequently.
Free trading may save you money on trading costs, but if it causes you to trade rashly, your returns may suffer.
As a fiscal conservative, I'm not too fond of taxes of any sort. I am a firm believer in "free markets."
I recently discussed why "Free, Isn't Really Free" regarding the retail investor. While "free...
Fintech Site
Plaid
Plaid is used by thousands of digital financial apps and services like Betterment, Expensify, Microsoft and Venmo, and by many of the largest banks to make it easy for consumers to connect their financial accounts with the apps and services they want to use. Plaid connects with over 11,000 financial institutions across the U.S, Canada and Europe.
Software
Tradestation
The tools to help put your plans into action.
Trade stocks, options, futures, futures options, and ETFs, with reliable execution on platforms built for advanced traders. We give you the tools to execute in numerous markets, the data and analytics to test and optimize your strategies, and the community to share your knowledge and learn new skills.
Chart Patterns
The Triple Bottom Pattern
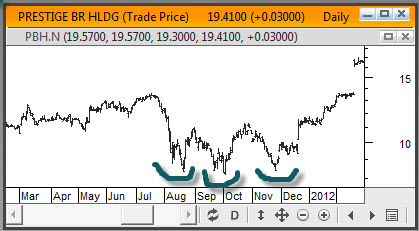
A triple bottom is a reversal pattern that displays three distinct minor lows at approximately the same price level. It generally takes at least three months to form and the longer the support levels hold, the more convi