Stoxxtip.com
Stoxxtip.com delivers easy-to-use guidance in global stock selection
for investors who wish to generate above-average returns on their portfolio.
Videos
How to Setup and Use Ichimoku Cloud Charting in MetaStock XENITH by Nicole Elliott
Technicals
Ripple (XRP) - the outlook remains dismal.
written on April 04, 2026
The current price of ripple as of 4th April 2026 is $1.3118. This cryptocurrency recently broke through the Fibonacci 61.8% retracement level at 1.4670, based on the entire $0.11 to $3.66 range traded since February 2020.
Research
Could A 'Transaction Tax' Be A Good Thing?
by Lance Roberts

Summary
Over the years, I've heard from several clients who have had trouble disciplining themselves from trading too frequently.
Free trading may save you money on trading costs, but if it causes you to trade rashly, your returns may suffer.
As a fiscal conservative, I'm not too fond of taxes of any sort. I am a firm believer in "free markets."
I recently discussed why "Free, Isn't Really Free" regarding the retail investor. While "free...
Fintech Site
Addepar
Addepar is a software and data platform that is purpose-built for professional wealth, investment and asset management firms to deliver outstanding results for their clients. More than 850 leading firms trust Addepar to unlock the power and possibility of more informed, data-driven investing and advice. With client presence in more than 30 countries, Addepar’s platform aggregates portfolio, market and client data for over $4 trillion in assets.
Software
ProRealTime'
One of the best trading and technical analysis platforms.
ProRealTime's high quality charts, analytic tools and reliable market data received directly from the exchanges make it a powerful decision support tool.
Chart Patterns
The Falling Wedge Pattern
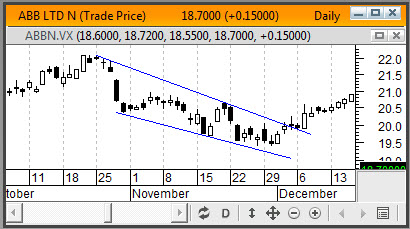
The falling wedge is a bullish pattern consisting of lower highs and lower lows of diminishing magnitude. The pattern is confirmed when the falling resistance line is broken, which should be accompanied by a rise in volu