| Stock | Symbol | Price 1st April 2023 | Price 1st July 2023 | Gain | % Gain |
|---|---|---|---|---|---|
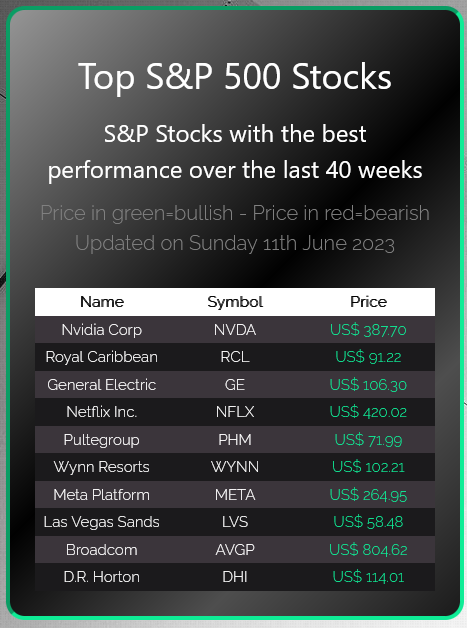
| General Electric | GE | $93.60 | $109.85 | $16.25 | 17.36 |
| Netflix | NFLX | $339.33 | $440.49 | $101.16 | 29.81 |
| Wynn Resorts | WYNN | $109.12 | $105.61 | -3.51 | -3.22 |
| Nvidia Corp. | NVDA | $270.37 | $423.02 | 152.65 | 56.46 |
| Royal Caribbean | RCL | $61.28 | $103.74 | $42.46 | 69.29 |
| Arista Networks | ANET | $159.85 | $162.06 | $2.21 | 1.38 |
| Las Vegas Sands | LVS | $57.01 | $58.00 | $0.99 | 1.74 |
| On Semiconductors | ON | $75.34 | $94.58 | $19.24 | 25.54 |
| HCA Healthcare | HCA | $270.59 | $303.48 | $32.89 | 12.15 |
| Marathon Petrol | MPC | $128.68 | $116.60 | -$12.08 | -9.39 |
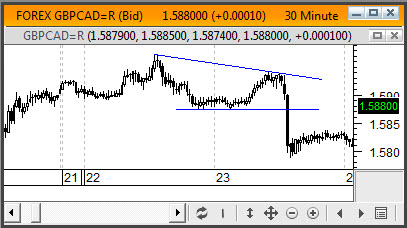
Technical Review
Featured Video