Stoxxtip.com

Stoxxtip.com

Stock Picks - Expert Consultants - Stoxxtip.com

Stoxxtip.com delivers easy-to-use guidance in global stock selection for investors who wish to generate above-average returns on their portfolio.

Stoxxtip Stock Scanning Module

Stoxxtip Stock Scanning Module

The Stoxxtip stock scanning module delivers an easy-to-use guidance in global stock selection for investors who wish to generate above-average returns on their portfolio.

The Stoxxtip market scanning module covers four major stocks markets and selects index constituent companies which have delivered the highest performance over the past 40 weeks. The Stoxxtip weekly updated stock scan list is a portfolio of 40 well capitalized stocks based on performance momentum selected by Tim Straiton (Research Director at Stoxxtip.com). The Stoxxtip scan filter will show you the stocks to buy with the highest probability of upside potential.

Realize your investment goals with the Stoxxtip stock scanning module

Stoxxtip.com stock scan sample

The Stoxxtip Stock Scanning Concept

The Stoxxtip stock scanning module is based on momentum trading over an extended time frame according to the following formula:
P= M - Mx
where:
M= the latest closing price
Mx= the closing price x periods ago

Momentum Trading

Bullish momentum trading is a strategy which scans for stocks exhibiting a long term continued upward trend. In order that this strategy can result in satisfactory results, constant monitoring of the price development is required and strict stop loss levels must be adhered to. Factors such as position sizing and the calculation of maximum risk levels are of utmost importance. Use our position sizing calculator to manage open position risk. Whilst the purchase of high performing stocks over the long term can result in outstanding profits, it should be remembered that many stocks in certain circumstances can rise to considerably higher levels than fundamentals might predict. This fact underlines the importance of strict risk management.
Stoxxtip Stock Scanning Results S&P 500 - published 1st April 2023
Stock Symbol Price 1st April 2023 Price 1st July 2023 Gain % Gain
General Electric GE $93.60 $109.85 $16.25 17.36
Netflix NFLX $339.33 $440.49 $101.16 29.81
Wynn Resorts WYNN $109.12 $105.61 -3.51 -3.22
Nvidia Corp. NVDA $270.37 $423.02 152.65 56.46
Royal Caribbean RCL $61.28 $103.74 $42.46 69.29
Arista Networks ANET $159.85 $162.06 $2.21 1.38
Las Vegas Sands LVS $57.01 $58.00 $0.99 1.74
On Semiconductors ON $75.34 $94.58 $19.24 25.54
HCA Healthcare HCA $270.59 $303.48 $32.89 12.15
Marathon Petrol MPC $128.68 $116.60 -$12.08 -9.39

Technical Review

Watch Platinum

2025-04-28 by Tim Straiton

The chart below is the daily Gold/Platinum ratio which has formed a classical head and shoulders formation and is currently trading at 3.34 after having reached an all time high of 3.561 on 21st of April 2025.

The 14 day relative strength index has shown bearish divergence developing since early April whilst the MACD-V indicator is retreating from the extremely overbought area of 347. The NYMEX Platinum Futures Managed Money Short Positions level of 35520 as of April 22nd, is higher than the level a year ago when it stood at 29707. The World Platinum Investment Council's five year supply/demand outlook foresees that the material platinum market deficits established during 2023 and 2024 are set to persist throughout the forecast period through 2029.

On the weekly chart, the Bollinger bandwidth is at an extremely low level which reflects the relatively narrow trading range over an extended period. It is also a warning that a break out of the recent support and resistance lines could be explosive. A weekly close above 1030 would bring life into this totally neglected market. The current price is $985 and above the 40 week moving average of 962.


Disclaimer

Our opinions are not a recommendation to buy or sell a security. Your decision whether or not to open a transaction should be based on your own due diligence and not on any representation we make to you.

Featured Video

The RMO ATM 3.0 Trading System

The RMO (inbuilt in MetaStock) has been one of MetaStock's most popular systems by far, and the RMO ATM is also no exception when it comes to plug-ins.

A Brokers Site Worth Visiting

Ameritrade

Online futures etf, stock and options broker
http://www.tdameritrade.com

Chart Patterns

Flag or Pennant

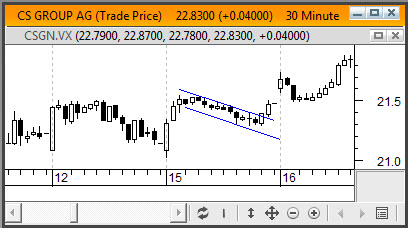
A flag or pennant is a continuation pattern which portrays a period of consolidation in the market before resumption of the original trend. They can be observed in both rising and falling markets. A rise in volume should be observed at the breakout point. If this is not the case then the move is likely to falter.
Flag or Pennant