Stoxxtip.com
Stoxxtip.com delivers easy-to-use guidance in global stock selection
for investors who wish to generate above-average returns on their portfolio.
Videos
In this presentation, Kelly Clement shows you how to use the Equities Guide in XENITH Real-Time Market Data and News.
Technicals
Micron Technology - Signs of bullish exhaustion evident.
written on November 22, 2025
Micron Technology (MU) closed the week at $207.37, having traded as high as $260 where it was 48% above the 40 week moving average. The weekly MACD-V indicator is at an extended level of 186, making further immediate gains unlikely.
Research
Five Guiding Principles of Trading Psychology
by Brett N. Steenbarger, Ph.D.

When I recently participated in an online chat presentation for John Forman, I assembled my ideas into ten basic principles that have guided my thinking about the psychology of traders and the psychology of markets. In the very near future, if my testing continues to be promising, I hope to present a market indicator for swing traders that rests firmly upon these principles. Stay tuned! In the interim, here are the five principles that pertain specifically to trading psychology. Next up will be...
Fintech Site
Northern Trust
As a global leader in innovative wealth management, asset servicing and investment solutions, Northern Trust (Nasdaq: NTRS) is proud to guide the world’s most successful individuals, families and institutions by remaining true to our enduring principles of service, expertise and integrity. A globally recognized Fortune 500 Company in continuous operation since 1889, we’ve built a legacy of empowering clients to reach their goals with confidence.
Software
Elasticity 2.0
The Elasticity 2 Trading System addresses traders' demand for an easy-to-use trading concept that delivers a relatively high win-to-loss ratio and triggers trading signals in the direction of the current trend. It also indicates a protective stop loss and a suggested profit target on every trading signal generated.
The Elasticity 2 Trading System is accompanied by a convenient template that displays stop loss levels, profit target levels, and the 29-period moving average. This... Read on.
Chart Patterns
The Triple Bottom Pattern
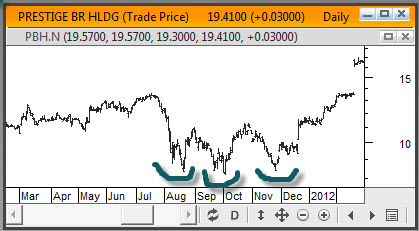
A triple bottom is a reversal pattern that displays three distinct minor lows at approximately the same price level. It generally takes at least three months to form and the longer the support levels hold, the more convi