Stoxxtip.com
Stoxxtip.com delivers easy-to-use guidance in global stock selection
for investors who wish to generate above-average returns on their portfolio.
Videos
OptionScope is a specialized analysis tool integrated into MetaStock designed specifically for options traders. It functions as a powerful option chain viewer and analyzer, allowing users to filter, sort, and examine option data for specific securities in a highly customizable grid.
Technicals
Davita Inc. Signs of overheating emerging.
written on July 12, 2026
DaVita Inc. (DVA) incorporated in Delaware and headquartered in Denver, closed the week at $232.80. The company has a market capitalization of $14.9 billion. It provides kidney dialysis services for patients suffering from chronic kidney failure i
Research
How to Take a Loss
by Brett N. Steenbarger, Ph.D.

There are quite a few books written on how to make money in the market. Some of them are even written by people who have made money as traders! What you don’t see often, however, are books or articles written on how to lose money. “Cut your losers and let your winners run” is commonsensical advice, but how do you determine when a position is a loser? Interestingly, most traders I have seen don’t formulate an answer to this question when they put on a position. They focus on the entry,...

Software
IBKR Trading Platforms

Our award-winning platforms offer powerful trading features and streamline solutions for all traders. IBKR offers desktop, mobile and online trading platforms with no platform fees. See which platform is best for your trading skills and investing strategies!
Chart Patterns
The Descending triangle Pattern
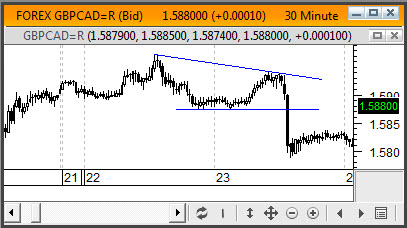
The descending triangle is a bearish formation that usually forms during a downtrend as a continuation pattern and indicates distribution. Once the horizontal line has been broken, the downside target should correspond t