Stoxxtip.com
Stoxxtip.com delivers easy-to-use guidance in global stock selection
for investors who wish to generate above-average returns on their portfolio.
Videos
In the brief demo, Kelly Clement shows how XENITH gathers the essential news, data, analytics, commentary and insights you need in one place, so you can act quickly and confidently. Access to XENITH is included with your MetaStock Pro subscription, and may also be purchased as a separate subscription
Technicals
Nvidia - From bull trend to no trend.
written on August 20, 2025
Nvidia closed on Tuesday 19th August at 175.64. The strong bull trend which started in early May 2025 appears to be showing signs of exhaustion as shown in the high value of the choppiness index (55) and also the relatively high value in the ATR/
Research
Five Guiding Principles of Trading Psychology
by Brett N. Steenbarger, Ph.D.

When I recently participated in an online chat presentation for John Forman, I assembled my ideas into ten basic principles that have guided my thinking about the psychology of traders and the psychology of markets. In the very near future, if my testing continues to be promising, I hope to present a market indicator for swing traders that rests firmly upon these principles. Stay tuned! In the interim, here are the five principles that pertain specifically to trading psychology. Next up will be...
Fintech Site
Cash App

Initially built to take the pain out of peer-to-peer payments, Cash App has gone from a simple product with a single purpose to a dynamic app, bringing a better way to send, spend, invest, borrow and save to our millions of monthly active users. With a mission to redefine the world's relationship with money by making it more relatable, instantly available and universally accessible.
Software
Metastock

Whether you're a real-time trader, swing trader, or end-of-day trader, MetaStock delivers reliable buy and sell signals across stocks, options, futures, forex, and more. Join thousands of active traders who choose MetaStock as their go-to stock charting software -- and experience the edge it brings to your trading strategy.
Chart Patterns
The Head and Shoulders Pattern
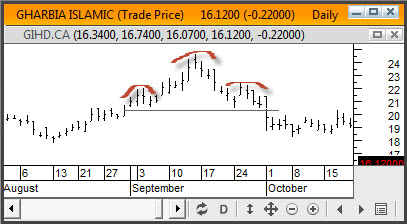
The head-and-shoulders pattern is believed to be one of the most reliable trend-reversal patterns. It consists of three successive rallies, the second being the highest. The name derives from the fact that on a chart the